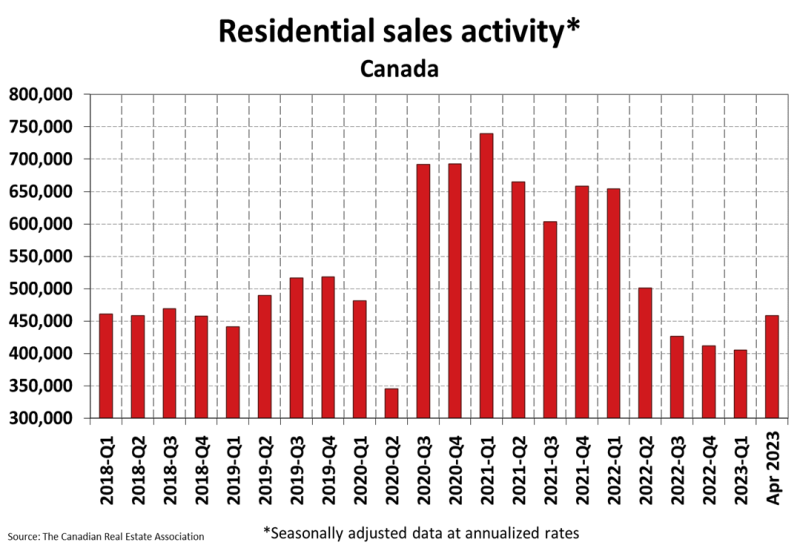
Ottawa, ON, May 15, 2023 – Statistics released today by the Canadian Real Estate Association (CREA) show national home sales jumped by double digits on a month-over-month basis in April 2023.
Highlights:
- National home sales surged 11.3% month-over-month in April.
- Actual (not seasonally adjusted) monthly activity came in 19.5% below April 2022.
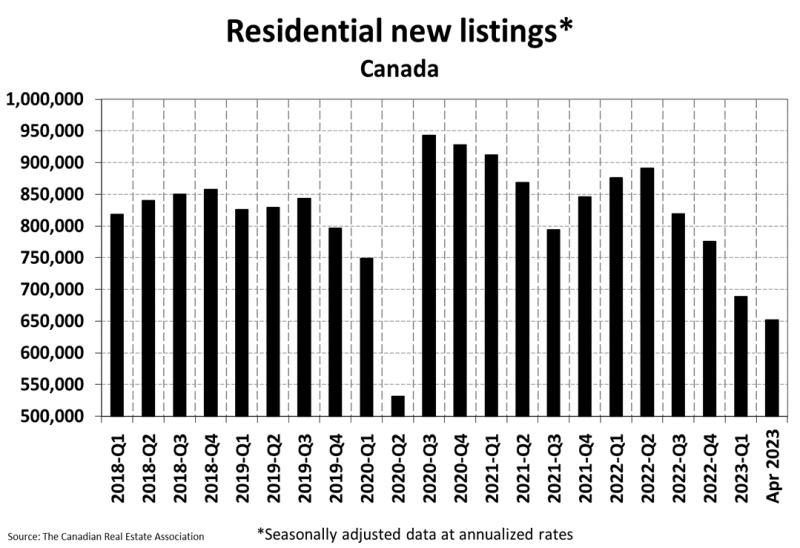
- The number of newly listed properties edged up 1.6% month-over-month but remain at a 20-year low.
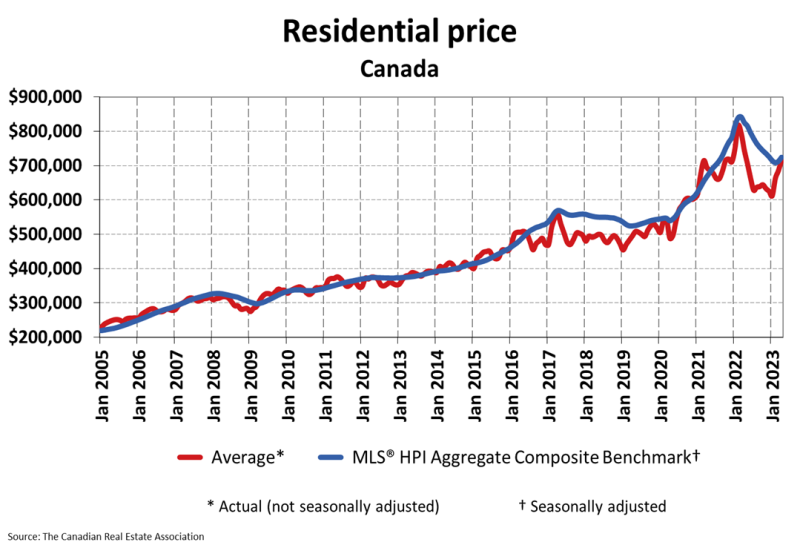
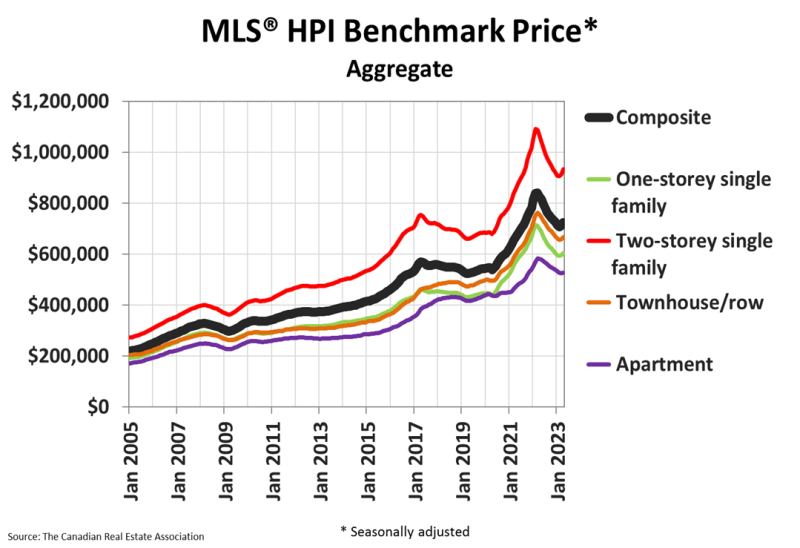
- The MLS® Home Price Index (HPI) climbed 1.6% month-over-month but was down 12.3% year-over-year.
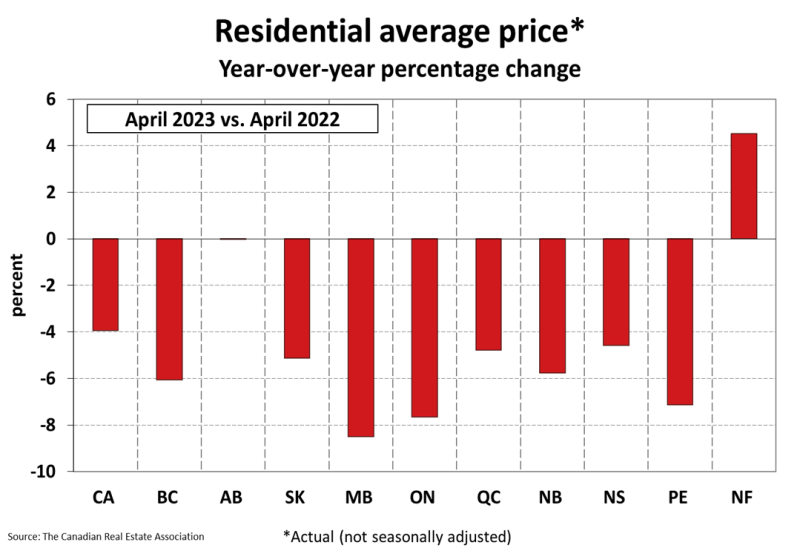
- The actual (not seasonally adjusted) national average sale price posted a 3.9% year-over-year decline in April.
MONTHLY HOUSING MARKET REPORT
Home sales recorded over Canadian MLS® Systems posted an 11.3% increase from March to April 2023, foreshadowed by smaller back-to-back gains recorded in February and March. (Chart A)
Following the trend seen in recent months, the sales increase was broad-based but once again dominated by the B.C. Lower Mainland and the Greater Toronto Area (GTA).
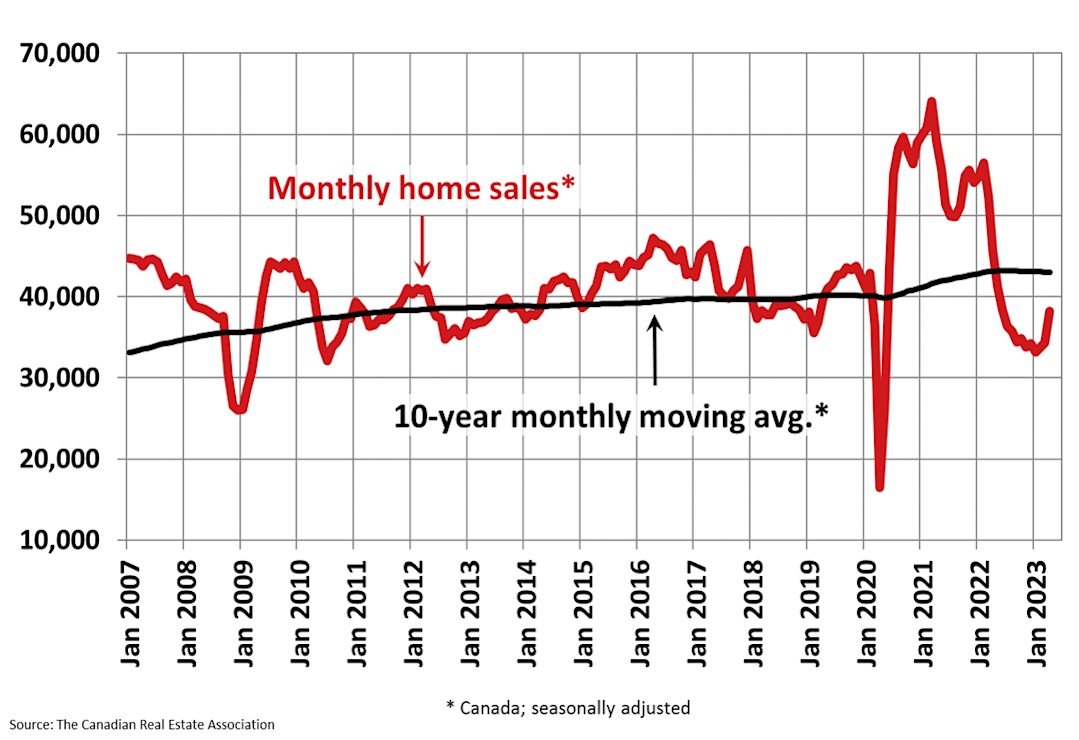
Chart A
The actual (not seasonally adjusted) number of transactions in April 2023 came in 19.5% below April 2022, a markedly smaller decline than those seen over the past year.
“Over the last few months, there have been signs that housing markets were going to heat back up this year, so it wasn’t a surprise to see things take off after the Easter weekend, which often serves as the opener to the spring market,” said Larry Cerqua, CREA’s 2023-2024 Chair. “The issue going forward is not new: demand is once again returning at a scale that is outpacing supply. If you’re looking for information and guidance about how to buy or sell a property in this rapidly changing market, contact a REALTOR® in
your area,” continued Cerqua.
“With interest rates at a top, and home prices at a bottom, it wasn’t all that surprising to see buyers jumping off the sidelines and back into the market in April,” said Shaun Cathcart, CREA’s Senior Economist. “Supply, on the other hand, has been sluggish, hence the price gains from March to April seen all over the country. Looking ahead, the first week of May did see a bit of a burst of new supply, suggesting some of those April buyers were existing owners now looking to sell their current homes. That could make for the kind of virtuous circle that might ultimately get more first-time buyers into the ownership space this year.”
The number of newly listed homes edged up 1.6% on a month-over-month basis in April; although, the bigger picture is that new supply remains at a 20-year low.
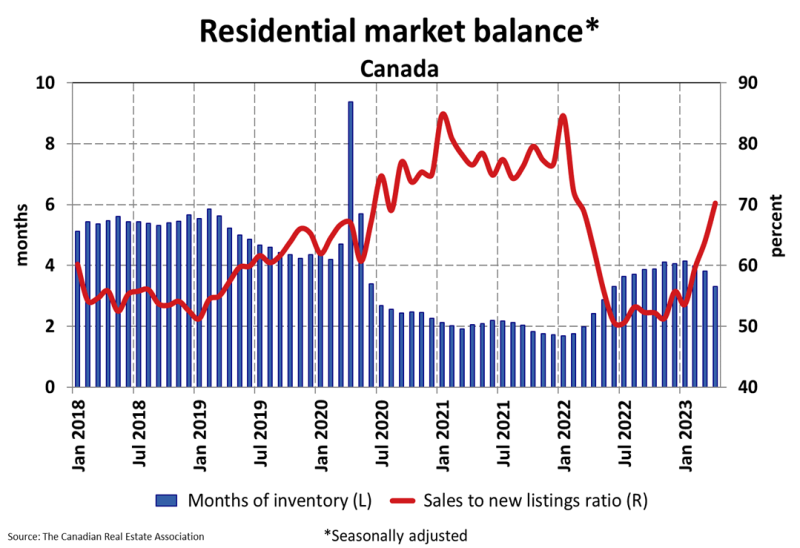
With sales gains vastly outpacing new listings in April, the sales-to-new listings ratio jumped to 70.2%, up from 64.1% in March. The long-term average for this measure is 55.1%
There were 3.3 months of inventory on a national basis at the end of April 2023, down half a month from 3.8 months at the end of March. The long-term average for this measure is about five months.
The Aggregate Composite MLS® Home Price Index (HPI) climbed 1.6% on a month-over-month basis in April 2023 – a large increase for a single month. It was also broad-based. A monthly increase in prices from March to April was observed in the majority of local markets.
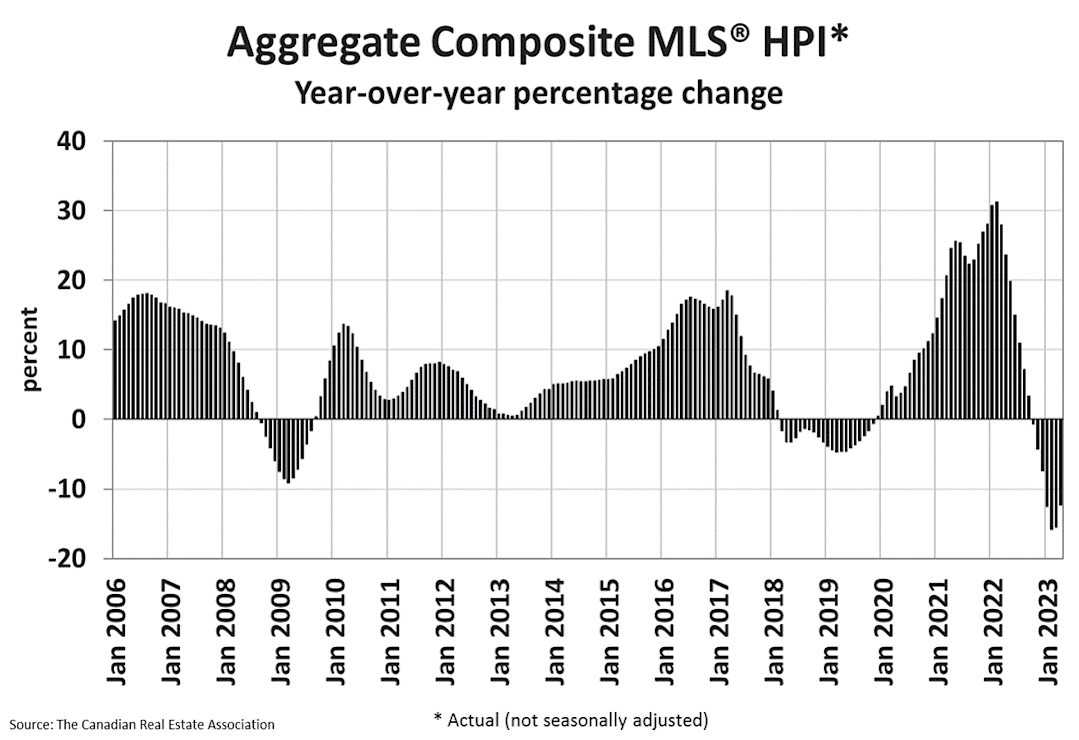
Chart B
The actual (not seasonally adjusted) national average home price was $716,000 in April 2023, down 3.9% from April 2022, but up $103,500 from January 2023, a gain owed to outsized sales rebounds in the GTA and B.C. Lower Mainland. Excluding the GTA and Greater Vancouver from the calculation cuts more than $144,000 from the national average price.


